Discriminatory Housing
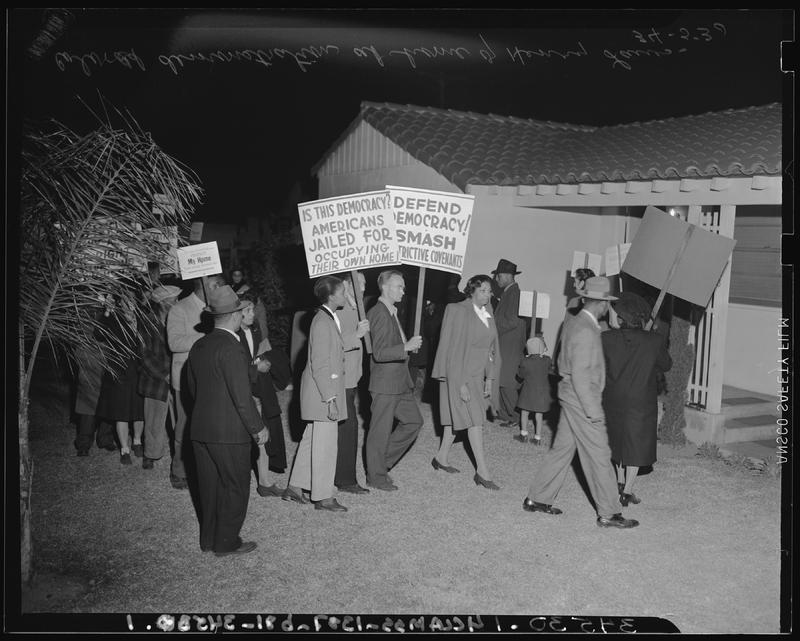
Courtesy of Los Angeles Daily News Collection, Department of Special Collections, Charles E. Young Research Library, UCLA
In the 1910s, Los Angeles established a national legal precedent for exclusionary zoning for upscale single-family residents. Typically, private homeowner associations excluded all non-Caucasians from occupancy, except as domestic servants. By World War I, deed restrictions—“restrictive covenants”—were enacted as Jim Crow legislation and enforced by these homeowner associations. By the 1920s, 95% of LA’s housing was off-limits to blacks and Asians.
Across the U.S., federal housing policy of the 1930s and ‘40s increased access to homeownership among whites, while increasing housing instability and displacement in minority communities. The Federal Housing Authority, established in 1934, and the GI Bill, passed in 1944, made homeownership a reality for millions of Americans. However, discriminatory lending practices such as “redlining”—a practice where banks refused to grant home-purchase loans in certain areas based on their ethnic/racial composition—denied many minorities these government-supported homeownership opportunities.
It wasn’t until the Civil Rights era in the 1960s that these redlining policies began to be legally dismantled, although discrimination in housing, such as the practice of racial steering by real estate agents, still exists today.
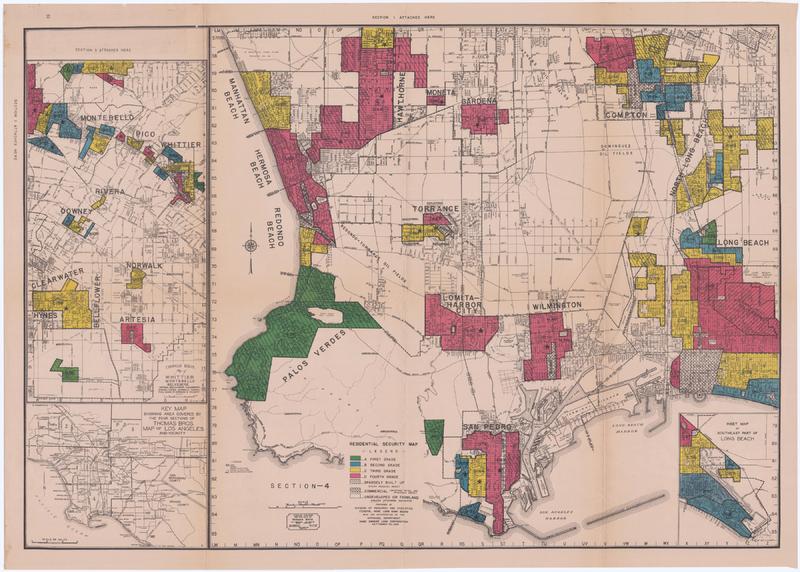
Courtesy of “T-RACES: A Testbed for the Redlining Archives of California’s Exclusionary Spaces,” R. Marciano, D. Goldberg, C. Hou, University of North Carolina.
From the Testbed for the Redlining Archives of California’s Exclusionary Spaces (T-RACES) project:
“Confidential Residential Security Maps for all major U.S. cities were prepared by the Home Owners’ Loan Corporation (HOLC), with special assistance from “competent local real estate brokers and mortgage lenders, believed to represent a fair and composite opinion of the best qualified local people.”
From “HOLC Division of Research and Statistics with Cooperation of the Appraisal Department, San Diego, October 20, 1936” (part of the San Diego redlining files):
“Red areas represent those neighborhoods in which the things that are now taking place in the Yellow neighborhoods, have already happened. They are characterized by detrimental influences in a pronounced degree, undesirable population or infiltration of it. Low percentage of home ownership, very poor maintenance and often vandalism prevail. Unstable incomes of the people and difficult collections are usually prevalent. The areas are broader than the so-called slum districts. Some mortgage lenders may refuse to make loans in these neighborhoods and other will lend only on a conservative basis.“
“Yellow areas are characterized by age, obsolescence, and change of style; expiring restrictions or lack of them; infiltration of a lower grade population; the presence of influences which increase sales resistance such as inadequate transportation, insufficient utilities, perhaps heavy tax burdens, poor maintenance of homes, etc. “Jerry” built areas are included, as well as neighborhoods lacking homogeneity. Generally, these areas have reached the transition period. Good mortgage lenders are more conservative in the Yellow areas and hold loan commitments under the lending ratio for the Green and Blue areas.“
“Blue areas, as a rule, are completely developed. They are like a 1935 automobile still good, but not what the people are buying today who can afford a new one. They are the neighborhoods where good mortgage lenders will have a tendency to hold loan commitments 10-15% under the limit.“
“Green areas are “hot spots”; they are not yet fully built up. In nearly all instances they are the new well planned sections of the city, and almost synonymous with the areas where good mortgage lenders with available funds are willing to make their maximum loans to be amortized over a 10-15-year period — perhaps up to 75-80% of the appraisal. They are homogeneous; in demand as residential locations in “good time” or “bad”; hence on the upgrade.”
Further Reading
Kwate, N. O. A., Loh, J. M., White, K., & Saldana, N. (2013). Retail Redlining in New York City: Racialized Access to Day-to-Day Retail Resources. Journal of Urban Health : Bulletin of the New York Academy of Medicine, 90(4), 632–652.
Zhang, M., & Debarchana, G. (2016). Spatial Supermarket Redlining and Neighborhood Vulnerability: A Case Study of Hartford, Connecticut. Transactions in GIS : TG, 20(1), 79–100.
Gee, G. C. (2008). A Multilevel Analysis of the Relationship Between Institutional and Individual Racial Discrimination and Health Status. American Journal of Public Health, 98(Suppl 1), S48–S56.